To celebrate the blog's 6th birthday I proposed to take suggestions for fact-checks from the audience on Twitter and Facebook. This is the first of the two winning fact-checks (a recommendation from my friend P.S.) and it deals with the contribution of shipping to the Greek economy.
The starting point for this fact-check is a Reuters special report, The Greek Shipping Myth, which cast doubt on the employment and GDP contribution figures cited by the Greek shipping industry (and echoed by much of the domestic and foreign press - eg the FT here). The core claim in this report is that the industry's contribution to the Greek economy is inflated because ELSTAT calculates the impact of shipping firms differently than the statistical agencies of other countries do - in particular, it includes in its calculations value added and employment that arise (and possibly stay) in other countries.
In brief: Reuters' claim is correct in its essence. Shipping contributes less to the Greek economy than the industry lets people believe, if by 'economy' one reads 'gross national income' or 'domestic employment'. It is also likely that it contributes a lot less to GDP than the industry claims, although without further input from ELSTAT on the 'domesticity' of its product this is very hard to assess. The treatment of shipping in Greek national accounts is not as unique as Reuters claims - to some extent, countries such as the UK and Cyprus also appear to record it in similar ways. It does, however, contrast sharply to the way in which German statisticians measure the industry, and which is completely aligned with Reuters' preferred approach.
'We're gonna need a bigger boat'
At the risk of flirting with conspiracy theories, it is worth explaining the context of the Reuters publication and the FT coverage cited above. The last few years have seen sustained pressure applied on Greek governments to raise taxes on the shipping industry. It's not just parts of the Greek left gunning for oligarchs that are behind this, either. The German shipping industry is said (see BBC article above) to be lobbying for a review of the taxation of Greek shipping and the IMF appears to have been mulling proposals for further taxation for some time. Parallel to this, the European Commission has recently submitted a set of proposals to Greece on reforming maritime tax; basically asking us to bring some activities out of scope of our tonnage tax system as niche sectors were looking like they were gaming the system.
There is a big obstacle to taxing the shipping industry further, as a forty-year old law (27/1975), given a kind of special status by direct reference in article 107 of the Greek Constitution of 1975, exempts any company that pays tonnage tax in Greece from paying any other corporation tax or capital gains tax on sales of vessels. The exemption even extends to individual shareholders; see more details on p 173 here. This is pretty heavy stuff; it means it's not just difficult to apply income tax to the shipping industry and its owners - it's virtually unconstitutional. The last Greek government got around this problem in 2013 by establishing a voluntary agreement with the industry for an additional levy, and then formalising aspects of this into law. This idea had originally been mooted in 2011, during negotiations on the second Greek bailout, and effectively means that Greek-owned shipping companies (regardless of flag) will have paid an additional EUR420m between 2014 and 2017 (and no less than EUR105m in any given year). It's a steep increase from the amount of tonnage tax receipts which bring in a risible EUR12m per year (in 2012; historical data available here under the 'EL' tab), but clearly this amount still looks relatively modest.
In short: there's a hell of a lot of money to play for; national statisticians are swimming with sharks and Reuters' claim is that they've long avoided being eaten but cutting a deal.
Shipping in the ocean of data
It's not easy to pin down shipping in national statistics. This is because the full suite of relevant sectors are only really identifiable at the 4-digit level of the European Union's revised standard industry classification (NACE rev. 2). The NACE rev. 2 codes we're potentially looking at are as follows:
C: MANUFACTURING
30.11: Building of ships and floating structures
30.12: Building of pleasure and sporting boats
33.15: Repair and maintenance of ships and boats.
H: TRANSPORTATION AND STORAGE
50.10 Sea and coastal passenger water transport
50.20 Sea and coastal freight water transport
52.10 Warehousing and Storage activities for transportation
52:22: Support activities incidental to water transportation
N: ADMINISTRATIVE AND SUPPORT SERVICE ACTIVITIES
77.34: Rental and leasing of water transport equipment
Even then, there is room for discretion. I would be careful, for example, about counting anything other than codes 50.20, 52.22 and 77.34 under 'shipping,' though I would count almost all of the rest as part of the 'maritime cluster.' Even then, I would be careful about including code 52.10: it's likely that warehousing support for shipping is only a small part of this activity, and it's impossible to disaggregate it further. The 'maritime cluster' sectors are a unit of sorts because they share skillsets and specialisms, not to mention historical, corporate and family ties. But it's fair to say that the industries of the broader cluster respond to completely different sources of demand - demand for yachts, ferry rides and cruises isn't really driven by the currents of world trade, except perhaps in the very long term. And you wouldn't really expect to tax these sectors by tonnage, would you?
There is a shortcut that researchers can and do use to get round all of this detail. NACE rev 2 code 50 (water transport) is a 2-digit sector and therefore a lot more statistics are publicly available for it; and intermediate demand for water transport from other industries is a half-decent proxy for shipping output, because it strips out demand for passenger travel and other non-trade related things.
Using Eurostat's supply and use tables here it's relatively easy to see what the top line is for 'water transport services.' Some EUR15bn per year, as of 2010, almost all of it from exports. These are the latest and only figures on intermediate consumption of shipping that are available to us, but happily they are not the only figures we can rely on.
A missing middleman?
Contrary to what the Reuters piece might have you think, Greece's ELSTAT does not publish regular releases specifically on the contribution of the shipping industry, the way it might do with say, manufacturing or services as a whole. It does, however, quietly prepare estimates of value added and employment in the industry for the purposes of compiling national accounts - which in turn feed into estimates of Greek GDP and productivity.
You can see ELSTAT's breakdown of GDP components for 'water transport services' here. This roughly confirms the topline figure I cited above (15.8bn in 2010 but EUR12.8bn in 2014) and suggests that the industry contributed EUR5.7bn of value added in 2014, down from EUR6.6bn in 2010. ELSTAT provides the same figures on its own website here. Accounting for the sector's own demand for goods and services, in turn, produces this table, which suggests value added of EUR6.1bn in 2010.
That the two sets of figures are not identical is a little odd. They ought to be, yet you'll notice a difference of EUR460m in the industry's value added, as well as the fact that the water transport sector seems to buy almost no services (a puny EUR28m!) from itself. Now what could that be? It's rare, after all, for a broad (2-digit) industry to not use some of its own product as inputs. This to me is a first hint that there might be a missing middle-man in the GDP figures.
The impact studies
Unlike ELSTAT, the shipping industry and its observers in academia and think tanks are far from quiet about these estimates, and so the relevant figures have, in recent years, found their way into three widely-cited and to some extent overlapping assessments:
The starting point for this fact-check is a Reuters special report, The Greek Shipping Myth, which cast doubt on the employment and GDP contribution figures cited by the Greek shipping industry (and echoed by much of the domestic and foreign press - eg the FT here). The core claim in this report is that the industry's contribution to the Greek economy is inflated because ELSTAT calculates the impact of shipping firms differently than the statistical agencies of other countries do - in particular, it includes in its calculations value added and employment that arise (and possibly stay) in other countries.
In brief: Reuters' claim is correct in its essence. Shipping contributes less to the Greek economy than the industry lets people believe, if by 'economy' one reads 'gross national income' or 'domestic employment'. It is also likely that it contributes a lot less to GDP than the industry claims, although without further input from ELSTAT on the 'domesticity' of its product this is very hard to assess. The treatment of shipping in Greek national accounts is not as unique as Reuters claims - to some extent, countries such as the UK and Cyprus also appear to record it in similar ways. It does, however, contrast sharply to the way in which German statisticians measure the industry, and which is completely aligned with Reuters' preferred approach.
'We're gonna need a bigger boat'
At the risk of flirting with conspiracy theories, it is worth explaining the context of the Reuters publication and the FT coverage cited above. The last few years have seen sustained pressure applied on Greek governments to raise taxes on the shipping industry. It's not just parts of the Greek left gunning for oligarchs that are behind this, either. The German shipping industry is said (see BBC article above) to be lobbying for a review of the taxation of Greek shipping and the IMF appears to have been mulling proposals for further taxation for some time. Parallel to this, the European Commission has recently submitted a set of proposals to Greece on reforming maritime tax; basically asking us to bring some activities out of scope of our tonnage tax system as niche sectors were looking like they were gaming the system.
There is a big obstacle to taxing the shipping industry further, as a forty-year old law (27/1975), given a kind of special status by direct reference in article 107 of the Greek Constitution of 1975, exempts any company that pays tonnage tax in Greece from paying any other corporation tax or capital gains tax on sales of vessels. The exemption even extends to individual shareholders; see more details on p 173 here. This is pretty heavy stuff; it means it's not just difficult to apply income tax to the shipping industry and its owners - it's virtually unconstitutional. The last Greek government got around this problem in 2013 by establishing a voluntary agreement with the industry for an additional levy, and then formalising aspects of this into law. This idea had originally been mooted in 2011, during negotiations on the second Greek bailout, and effectively means that Greek-owned shipping companies (regardless of flag) will have paid an additional EUR420m between 2014 and 2017 (and no less than EUR105m in any given year). It's a steep increase from the amount of tonnage tax receipts which bring in a risible EUR12m per year (in 2012; historical data available here under the 'EL' tab), but clearly this amount still looks relatively modest.
In short: there's a hell of a lot of money to play for; national statisticians are swimming with sharks and Reuters' claim is that they've long avoided being eaten but cutting a deal.
Shipping in the ocean of data
It's not easy to pin down shipping in national statistics. This is because the full suite of relevant sectors are only really identifiable at the 4-digit level of the European Union's revised standard industry classification (NACE rev. 2). The NACE rev. 2 codes we're potentially looking at are as follows:
C: MANUFACTURING
30.11: Building of ships and floating structures
30.12: Building of pleasure and sporting boats
33.15: Repair and maintenance of ships and boats.
H: TRANSPORTATION AND STORAGE
50.10 Sea and coastal passenger water transport
50.20 Sea and coastal freight water transport
52.10 Warehousing and Storage activities for transportation
52:22: Support activities incidental to water transportation
N: ADMINISTRATIVE AND SUPPORT SERVICE ACTIVITIES
77.34: Rental and leasing of water transport equipment
Even then, there is room for discretion. I would be careful, for example, about counting anything other than codes 50.20, 52.22 and 77.34 under 'shipping,' though I would count almost all of the rest as part of the 'maritime cluster.' Even then, I would be careful about including code 52.10: it's likely that warehousing support for shipping is only a small part of this activity, and it's impossible to disaggregate it further. The 'maritime cluster' sectors are a unit of sorts because they share skillsets and specialisms, not to mention historical, corporate and family ties. But it's fair to say that the industries of the broader cluster respond to completely different sources of demand - demand for yachts, ferry rides and cruises isn't really driven by the currents of world trade, except perhaps in the very long term. And you wouldn't really expect to tax these sectors by tonnage, would you?
There is a shortcut that researchers can and do use to get round all of this detail. NACE rev 2 code 50 (water transport) is a 2-digit sector and therefore a lot more statistics are publicly available for it; and intermediate demand for water transport from other industries is a half-decent proxy for shipping output, because it strips out demand for passenger travel and other non-trade related things.
Using Eurostat's supply and use tables here it's relatively easy to see what the top line is for 'water transport services.' Some EUR15bn per year, as of 2010, almost all of it from exports. These are the latest and only figures on intermediate consumption of shipping that are available to us, but happily they are not the only figures we can rely on.
A missing middleman?
Contrary to what the Reuters piece might have you think, Greece's ELSTAT does not publish regular releases specifically on the contribution of the shipping industry, the way it might do with say, manufacturing or services as a whole. It does, however, quietly prepare estimates of value added and employment in the industry for the purposes of compiling national accounts - which in turn feed into estimates of Greek GDP and productivity.
You can see ELSTAT's breakdown of GDP components for 'water transport services' here. This roughly confirms the topline figure I cited above (15.8bn in 2010 but EUR12.8bn in 2014) and suggests that the industry contributed EUR5.7bn of value added in 2014, down from EUR6.6bn in 2010. ELSTAT provides the same figures on its own website here. Accounting for the sector's own demand for goods and services, in turn, produces this table, which suggests value added of EUR6.1bn in 2010.
That the two sets of figures are not identical is a little odd. They ought to be, yet you'll notice a difference of EUR460m in the industry's value added, as well as the fact that the water transport sector seems to buy almost no services (a puny EUR28m!) from itself. Now what could that be? It's rare, after all, for a broad (2-digit) industry to not use some of its own product as inputs. This to me is a first hint that there might be a missing middle-man in the GDP figures.
The impact studies
Unlike ELSTAT, the shipping industry and its observers in academia and think tanks are far from quiet about these estimates, and so the relevant figures have, in recent years, found their way into three widely-cited and to some extent overlapping assessments:
- The BCG Assessment of 2013
- The IOBE assessment of 2013.
- The Oxford Economics Assessment of 2014.
A Waste of Money at Reuters
Reuters comes to this conclusion by looking at a sample of company accounts for the Greek offices of shipping companies - which account for only a fraction of the value added and employment claimed by the industry. This must have been a heroic effort - but also a wasted one, as ELSTAT had already done this work for them, The results can now be found in Eurostat's annual detailed enterprise statistics, and have two advantages: first, they go to enough detail to identify shipping extremely closely; second, they are limited to shipping enterprises registered in each member state.
Whatever the quality of the overall dataset, I believe there is no doubting the value added figures, which tally well with Reuters' estimates. The narrow shipping sector's value added (at factor costs) is barely EUR380m, based on output of EUR 735m. The broad maritime cluster produces a more respectable EUR936m of value added, on turnover of EUR2.2bn. Even this is miles away from the over EUR5bn that ELSTAT counts towards Greece's GDP. It's not just a question of inter-group transfers to companies outside Greece (like the ones, eg, that result in Starbucks' extremely low taxable income). If it were, then the top-line at least would presumably be the same regardless. It really looks like Reuters is right - the value added by shipping businesses registered abroad is being routinely included in the Greek GDP figures.
Then again, look again at the 2010 figures from enterprise stats - we may have our missing-middleman right there. At just over EUR400m, the sea freight sector's 2010 turnover from detailed enterprise statistics fits quite well into the gap between the two value added estimates for 'water transport' that we saw earlier - suggesting that the Greek-registered businesses (local management offices, in Reuters' article) produce nothing but intermediate inputs into an international industry that is somehow considered to be Greek in our annual accounts. Depending on whether the estimate is run top-down or bottom-up, they disappear into opaque group accounts, instead of being tallied up as intermediate inputs, which produces the two separate value-added estimates we saw earlier.
Whose billions?
But what of the other EUR5bn? Is that Greek domestic value added or is it foreign value-added? And if it is foreign value-added, does it give rise to Greek incomes? Consistent with Reuters' theory, it looks like ELSTAT treats all value added from firms of Greek beneficial ownership as domestic, and adds it to GDP. There may be some basis for this. The question of when a transaction can be said to arise in a country's territory and therefore to be domestic is not one of economics but of statistical convention, for which we turn to the wisdom of the ESA2010 manual:
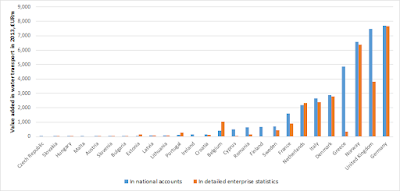
The entire EU water transport sector makes about 26.5bn of value added under the detailed enterprise statistics approach (2013 figures here) but 34bn under the GDP approach (see here). Greece, the United Kingdom, Cyprus and Romania have enormous shipping sectors in their national accounts compared to detailed enterprise statistics, while Germany, Norway, Denmark, the Netherlands and Italy provide roughly the same figures under both datasets. Finally, Belgium, Portugal and Estonia seem to have larger shipping sectors in enterprise statistics than in their national accounts.
But where does the money end up?
Whether you think their view of domesticity of shipping product is right or wrong, it's worth noting that ELSTAT makes no claim as to whether this domestic product produces national incomes. The industry claims this, on the basis of GDP figures, as it shouldn't. This is a fine distinction that Reuters fails to make but it does point to the true villain.
I make this introduction because there is a difference between GDP and Gross National Product (not to mention GDP and Gross National Income), and I wouldn't expect the two to be identical in the case of Greece .[I spoke too soon; in 2013 they were. But they don't have to be]. If shipping value added arises within Greece's borders, then there's no reason not to count it towards GDP. If it then immediately leaves the country to swell the coffers of foreign firms, then it won't count towards GNI, but that does not make the GDP calculation incorrect. Clearly, industry lobbyists have an interest in conflating GDP contributions with GNP/GNI contributions, but it is the latter that would give their argument against further taxation weight with the Greek authorities. Hence Reuters, despite a light mixup in terminology, is essentially right to question the numbers. The argument, however, cuts both ways. If so little of the sector's value is created in Greece, on what basis would the Greek government tax it?
Still, the industry claims that the disputed EUR5bn of value added somehow finds its way back to Greece. But in what way? There is no massive net inflow of funds to Greek business in the 'water transport' sector that would account for this difference. You can see this for yourselves here - a trifling EUR40m at last count, and net outflows in most years. There is, to be sure, a huge flow of remittances and wages earned abroad into Greece - nearly EUR1bn on last count. Unfortunately, it's hard to know how much of this is attributed to the shipping industry, and even if all of it were money from shipping employees abroad it wouldn't account for the full EUR5bn anyway.
Or does the money return as private flows of savings, consumption and charitable donations? The industry's flow of charitable giving is unrecorded but clearly massive. A single shipping-family foundation, for example, has been responsible for about EUR900m of easily-traceable charitable giving in Greece over the last ten years, of which at least a third has come post-crisis. It is said that much of the Greek ambulance service runs on donations from the shipping industry, and that many individual charities have benefited.
Without much more transparency from the notoriously secretive shipping families, it is impossible to answer this question. My guess is that the contribution of shipping to Greek national incomes is overstated by something in the order of EUR3-4bn. It also reflects very poorly on ELSTAT that they are not able to answer a straightforward question on how their value added figures are derived, and that they provide two different estimates of value added in the water transport sector (one in I-O tables and one in the national accounts, never mind the one in enterprise statistics). At the very least a methodological note would be very useful. Like, yesterday.
- You can check out the service components of the maritime cluster here, along with their (very detailed) income, employment* and value added figures.
- You may also want to add, for completeness, the activities of shipyards and dockyards, available separately here.
Whatever the quality of the overall dataset, I believe there is no doubting the value added figures, which tally well with Reuters' estimates. The narrow shipping sector's value added (at factor costs) is barely EUR380m, based on output of EUR 735m. The broad maritime cluster produces a more respectable EUR936m of value added, on turnover of EUR2.2bn. Even this is miles away from the over EUR5bn that ELSTAT counts towards Greece's GDP. It's not just a question of inter-group transfers to companies outside Greece (like the ones, eg, that result in Starbucks' extremely low taxable income). If it were, then the top-line at least would presumably be the same regardless. It really looks like Reuters is right - the value added by shipping businesses registered abroad is being routinely included in the Greek GDP figures.
Then again, look again at the 2010 figures from enterprise stats - we may have our missing-middleman right there. At just over EUR400m, the sea freight sector's 2010 turnover from detailed enterprise statistics fits quite well into the gap between the two value added estimates for 'water transport' that we saw earlier - suggesting that the Greek-registered businesses (local management offices, in Reuters' article) produce nothing but intermediate inputs into an international industry that is somehow considered to be Greek in our annual accounts. Depending on whether the estimate is run top-down or bottom-up, they disappear into opaque group accounts, instead of being tallied up as intermediate inputs, which produces the two separate value-added estimates we saw earlier.
Whose billions?
But what of the other EUR5bn? Is that Greek domestic value added or is it foreign value-added? And if it is foreign value-added, does it give rise to Greek incomes? Consistent with Reuters' theory, it looks like ELSTAT treats all value added from firms of Greek beneficial ownership as domestic, and adds it to GDP. There may be some basis for this. The question of when a transaction can be said to arise in a country's territory and therefore to be domestic is not one of economics but of statistical convention, for which we turn to the wisdom of the ESA2010 manual:
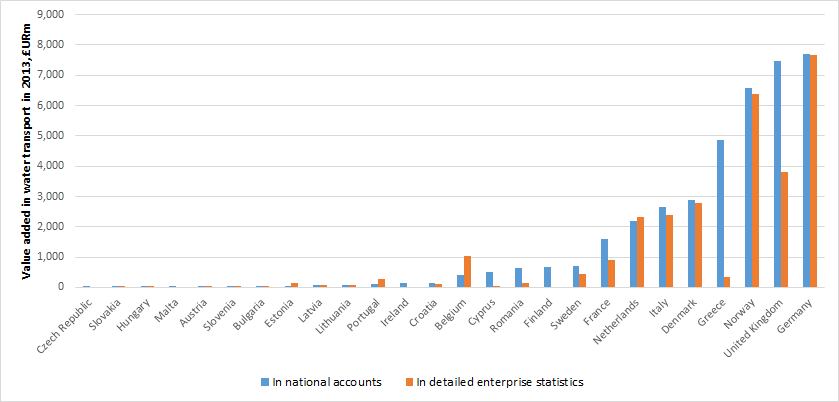
Exports of goods occur without the goods crossing the country’s frontier in the following examples: (a) goods produced by resident units operating in international waters are sold directly to nonresidents in foreign countries. Examples of such goods are oil, natural gas, fishery products, maritime’s salvage; (b) transportation equipment or other movable equipment not tied to a fixed location; (c) goods after changing ownership, which are lost or destroyed before they have crossed the frontier of the exporting country; (d) merchanting, i.e. the purchase of a good by a resident from a non-resident and the subsequent resale of the good to another non-resident, without the good entering the merchant’s economy. Analogous cases occur for the imports of goods.Is Greece as unique in this treatment as Reuters alleges? It's easy to test this by comparing the contribution of water transport (remember, this is not quite 'shipping'!) to gross value added under the national accounts with its contribution under enterprise statistics. Here I'm keeping passenger transport in the calculation so that we're comparing 'water transport' with 'water transport' and can therefore isolate the effects of statistical treatment, country of registration and ownership structure.
The entire EU water transport sector makes about 26.5bn of value added under the detailed enterprise statistics approach (2013 figures here) but 34bn under the GDP approach (see here). Greece, the United Kingdom, Cyprus and Romania have enormous shipping sectors in their national accounts compared to detailed enterprise statistics, while Germany, Norway, Denmark, the Netherlands and Italy provide roughly the same figures under both datasets. Finally, Belgium, Portugal and Estonia seem to have larger shipping sectors in enterprise statistics than in their national accounts.
But where does the money end up?
Whether you think their view of domesticity of shipping product is right or wrong, it's worth noting that ELSTAT makes no claim as to whether this domestic product produces national incomes. The industry claims this, on the basis of GDP figures, as it shouldn't. This is a fine distinction that Reuters fails to make but it does point to the true villain.
I make this introduction because there is a difference between GDP and Gross National Product (not to mention GDP and Gross National Income), and I wouldn't expect the two to be identical in the case of Greece .[I spoke too soon; in 2013 they were. But they don't have to be]. If shipping value added arises within Greece's borders, then there's no reason not to count it towards GDP. If it then immediately leaves the country to swell the coffers of foreign firms, then it won't count towards GNI, but that does not make the GDP calculation incorrect. Clearly, industry lobbyists have an interest in conflating GDP contributions with GNP/GNI contributions, but it is the latter that would give their argument against further taxation weight with the Greek authorities. Hence Reuters, despite a light mixup in terminology, is essentially right to question the numbers. The argument, however, cuts both ways. If so little of the sector's value is created in Greece, on what basis would the Greek government tax it?
Still, the industry claims that the disputed EUR5bn of value added somehow finds its way back to Greece. But in what way? There is no massive net inflow of funds to Greek business in the 'water transport' sector that would account for this difference. You can see this for yourselves here - a trifling EUR40m at last count, and net outflows in most years. There is, to be sure, a huge flow of remittances and wages earned abroad into Greece - nearly EUR1bn on last count. Unfortunately, it's hard to know how much of this is attributed to the shipping industry, and even if all of it were money from shipping employees abroad it wouldn't account for the full EUR5bn anyway.
Or does the money return as private flows of savings, consumption and charitable donations? The industry's flow of charitable giving is unrecorded but clearly massive. A single shipping-family foundation, for example, has been responsible for about EUR900m of easily-traceable charitable giving in Greece over the last ten years, of which at least a third has come post-crisis. It is said that much of the Greek ambulance service runs on donations from the shipping industry, and that many individual charities have benefited.
Without much more transparency from the notoriously secretive shipping families, it is impossible to answer this question. My guess is that the contribution of shipping to Greek national incomes is overstated by something in the order of EUR3-4bn. It also reflects very poorly on ELSTAT that they are not able to answer a straightforward question on how their value added figures are derived, and that they provide two different estimates of value added in the water transport sector (one in I-O tables and one in the national accounts, never mind the one in enterprise statistics). At the very least a methodological note would be very useful. Like, yesterday.


